
According to crypto analyst Rakesh Upadhyay, altcoins are showing compelling technical setups after Bitcoin price surpassed $42,000 on December 4. Can the bulls maintain their gains in certain altcoins, including Bitcoin and DOGE, or will higher levels attract aggressive selling by the bears? The analyst examines the charts to find out.
An overview of the cryptocurrency market
Bitcoin and Ethereum (ETH) broke above their overhead resistance levels on December 4. Thus, it showed that the bulls are in no mood to slow down. The higher the price rises without a meaningful correction, the greater the feeling of loss among traders. When traders chase prices higher, they lead to a breakout top before a correction begins. Cryptocurrency exchange Bybit said in its Q4 report that institutional investors hold 35% of their assets in Bitcoin, 15% in Ethereum, and the majority hold 45% of their assets in stablecoins. Traders hold only 5% of the rest of the altcoins. This shows that institutional investors still have enough firepower to buy the cryptocurrencies they want by selling stablecoins.
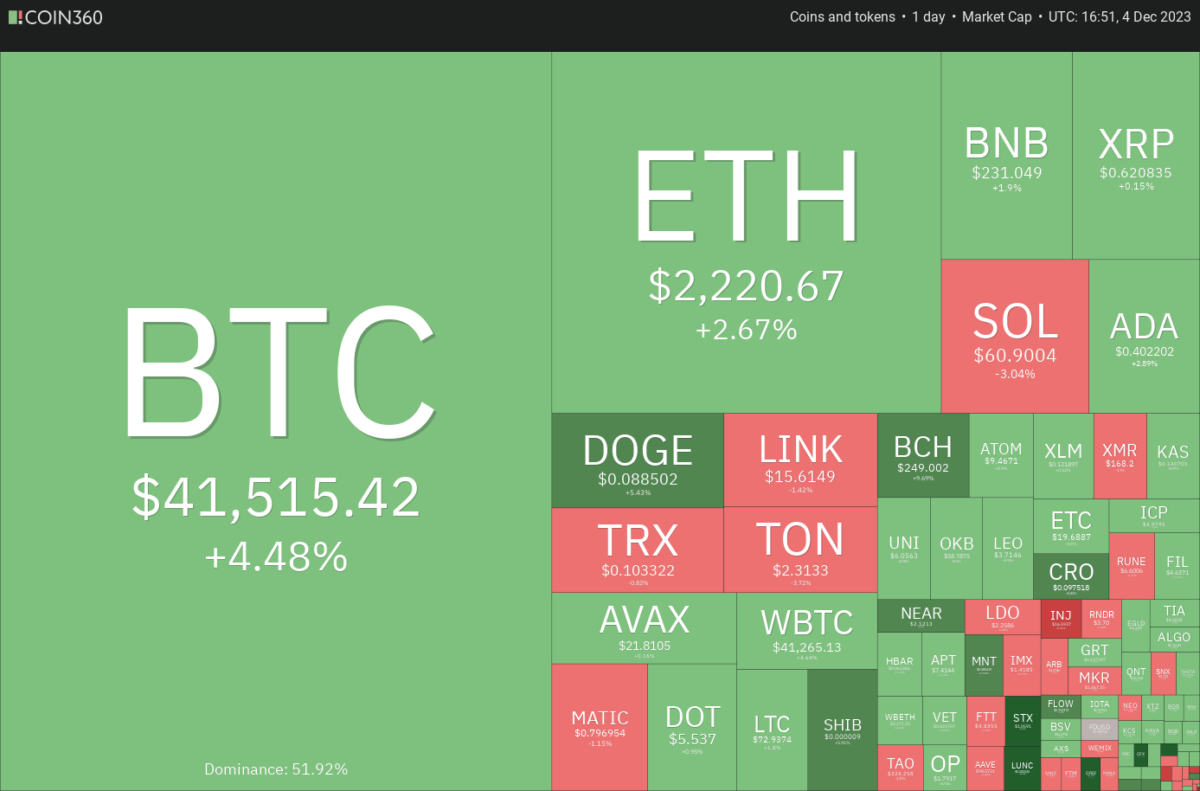 Daily cryptocurrency market performance. Source: Coin360
The previous three crypto bear markets were followed by a three-year bull cycle, and this time will be no different, with 2023 being the first year, Markus Thielen, head of research at Matrixport, said in a recent note. Thielen expects Bitcoin to reach $60,000 by April and $125,000 by the end of 2024.
BTC, ETH, BNB and XRP analysis
Bitcoin (BTC) price analysis
Bitcoin is in a strong uptrend. The bears failed to pose any challenge to $40,000. This shows that the bulls continue on their way.
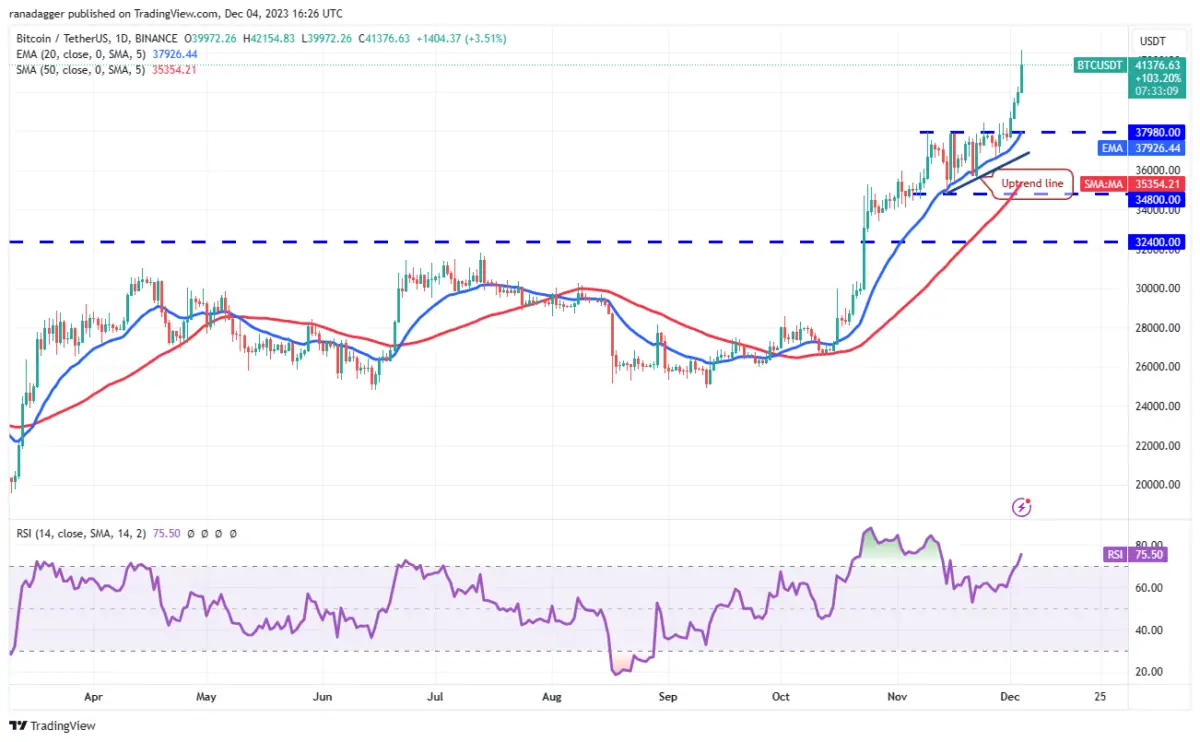
The sharp rise in the last few days has pushed the RSI into the overbought zone. This showed that a minor correction or consolidation was possible. Sometimes, when the trend is strong, the RSI tends to stay in the overbought zone for a long time. The next target on the upside is $48,000, with no major resistance levels in the way. With each rise, it becomes harder for the bears to stop the rally. If sellers want to make a comeback, they will need to stop the rally from the current level and pull BTC below the 20-day EMA ($37,926). This is likely to indicate the beginning of a deeper correction.
Ethereum (ETH) price analysis
ETH continued its march north. Thus, it broke above the $2,200 resistance on December 2. If the price closes above this resistance, it will complete the ascending triangle formation.
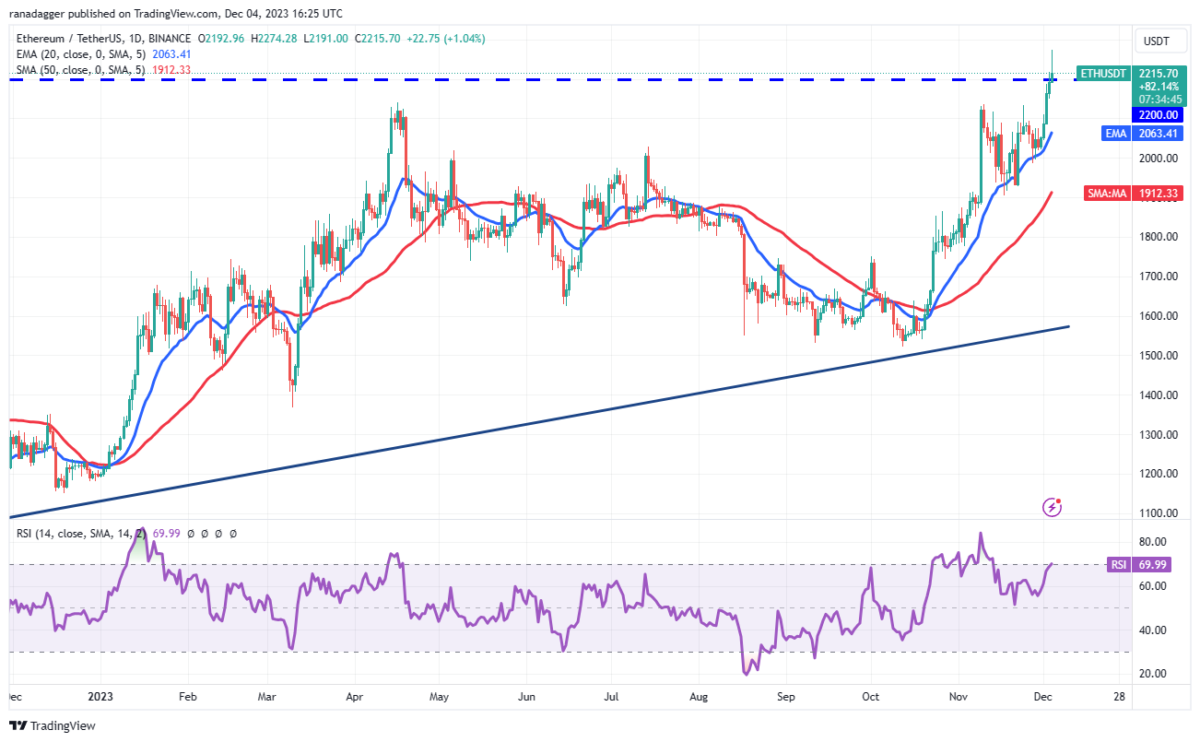
The rising 20-day EMA ($2,063) and the RSI near the overbought zone suggest the bulls are in control. The formation target of the breakout from the triangle is $3,400. However, the bears will not give up easily. They will try to cap the rally at $2,500 and again at $3,000. The first sign of weakness would be a break and close below the $2,200 breakout level. This will indicate that the breakout may be a fake move. The bears will further strengthen their position if they pull ETH below the 20-day EMA.
Binance Coin (BNB) price analysis
BNB has been consolidating in a narrow range between $239 and $223 for the past few days. This indicates indecision between buyers and sellers.
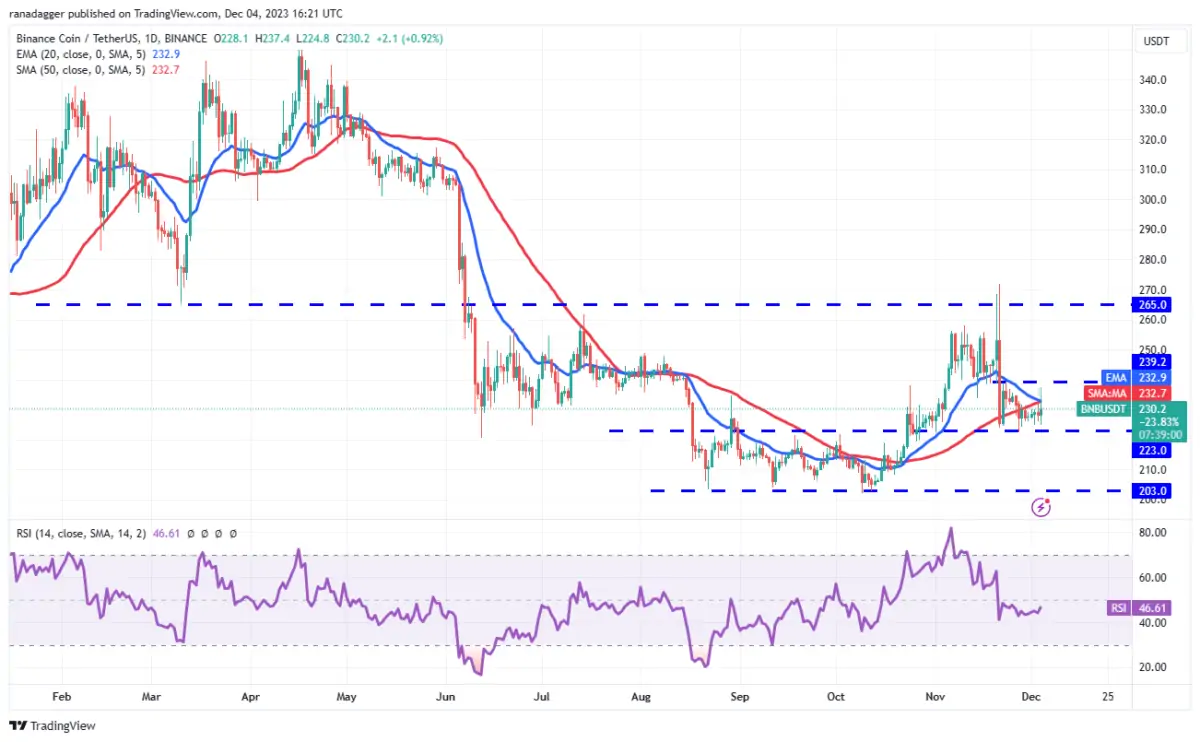
The falling 20-day EMA ($233) and the RSI just below the midpoint show that the bears have a slight advantage. If buyers break the $239 hurdle, it is possible for BNB to gain momentum. Thus, BNB is likely to rise to $265. Contrary to this assumption, if the price turns down from $239, the range-bound move will continue for a while longer. If the price falls below $223, selling is likely to intensify.
Ripple (XRP) price analysis
XRP broke above the 20-day EMA ($0.62) on December 2. However, the bulls could not capitalize on this move. This indicates a lack of demand at higher levels.
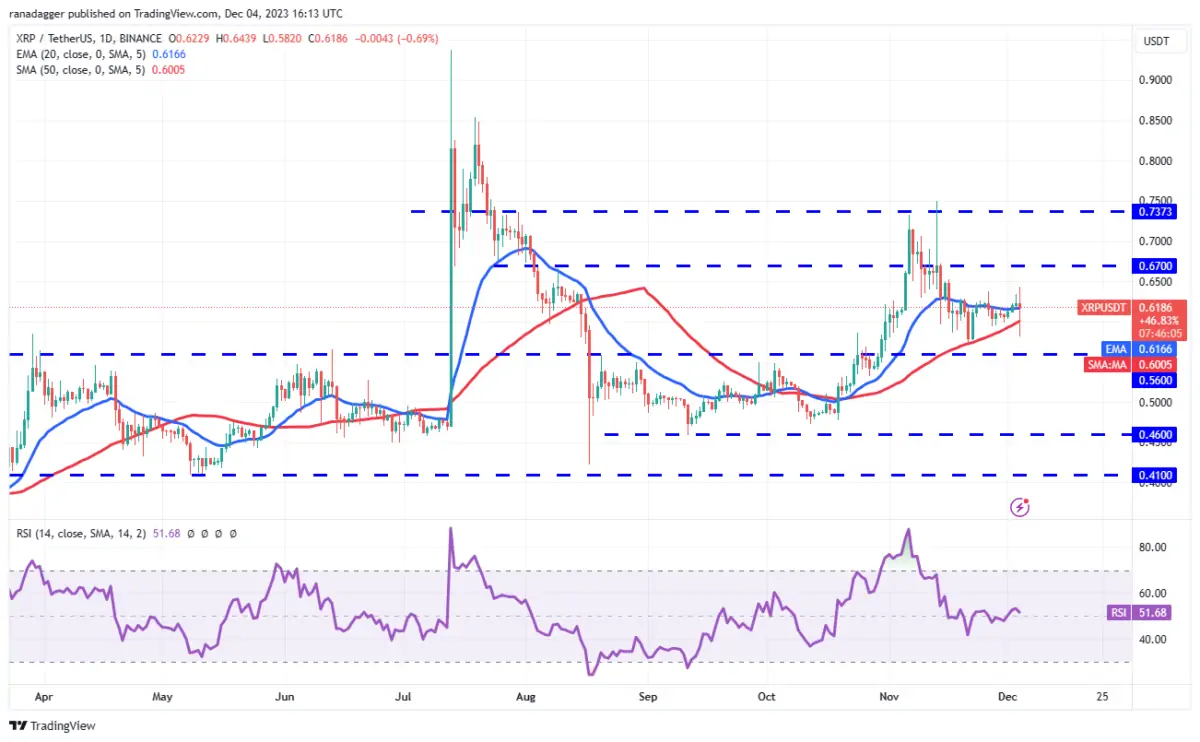
XRP formed a major outside day candlestick pattern on December 4, indicating a tough fight between bulls and bears. The 20-day EMA ($0.62) is flattening. Also, the RSI is close to the midpoint. This shows that there is a balance between supply and demand. This shows that XRP will oscillate between $0.67 and $0.56 for a while. If buyers push the price above $0.67, it is possible for XRP to rise to $0.74. Instead, if the price falls below $0.56, XRP is likely to drop to $0.46.
SOL, ADA, DOGE and LINK analysis
Solana (SOL) price analysis
Buyers are attempting to push Solana above the $68.20 overhead resistance and invalidate the head-and-shoulders formation.
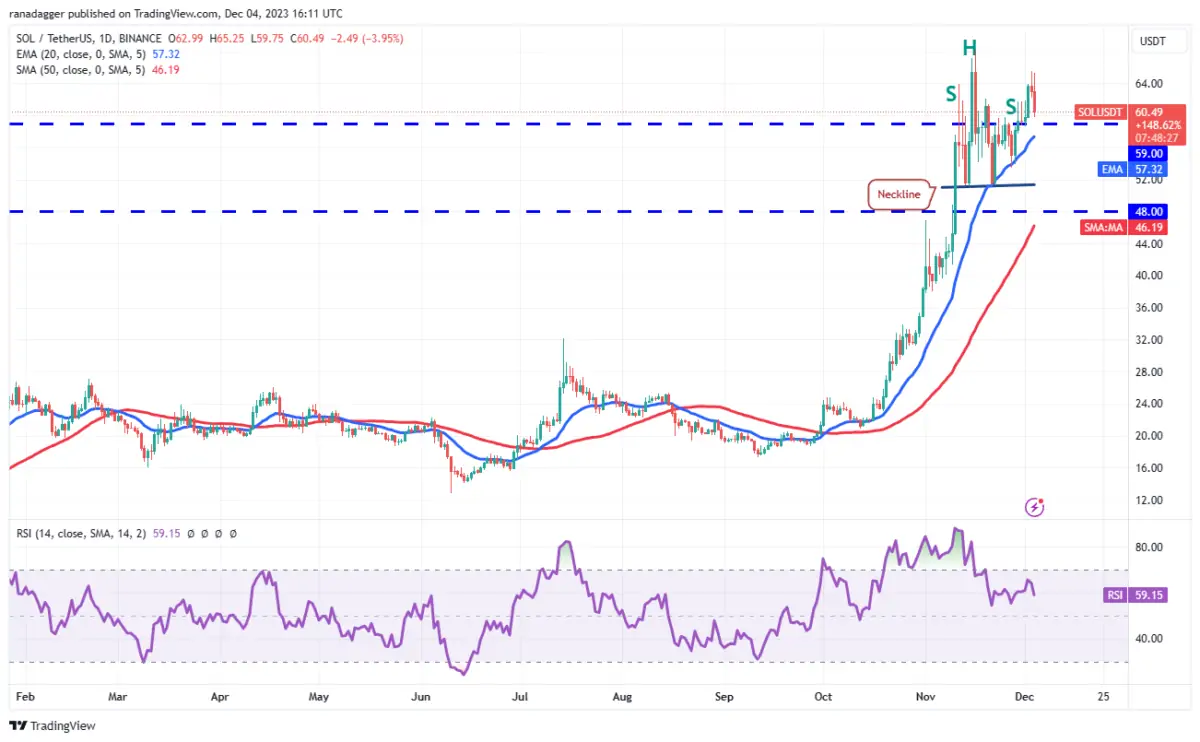
The failure of a bearish pattern is a bullish sign as it traps aggressive bears and leads to a short squeeze. However, buyers sitting on the sidelines due to the negative setup jump in to buy. If the bulls push the price above $68.20, a rally of SOL to $85 is possible. On the other hand, if the bears want to prevent an upward move, they will need to quickly pull the price below the 20-day EMA ($57). This is likely to open the door for it to retest the critical support at $51.
Cardano (ADA) price analysis
Buyers pushed ADA above the overhead resistance of $0.40 on December 4. But they are finding it difficult to sustain higher levels.
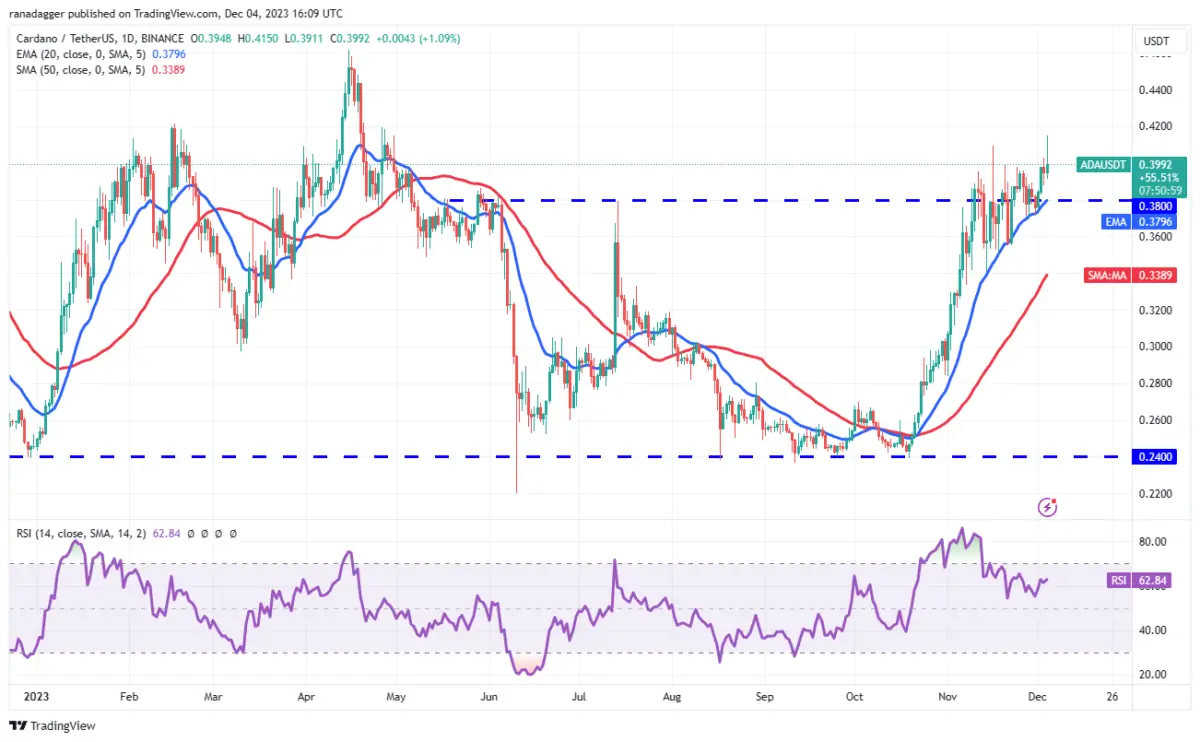
The long wick on the day’s candlestick shows that the bears are not giving up and are selling in rallies. If the price settles below $0.40, the bears will try to further strengthen their position by pulling ADA below the 20-day EMA ($0.38). If this support breaks, a drop to the 50-day SMA ($0.34) is possible. On the upside, a close above $0.40 could push the price to $0.42 and then to a new 52-week high of $0.46. This level is likely to attract strong selling by the bears. But if buyers bulldoze their way, it’s possible for ADA to skyrocket to $0.52.
Dogecoin (DOGE) price analysis
DOGE has been in a strong recovery over the past few days. The bulls pushed the DOGE price above $0.09 on December 4. Thus, it showed strong demand at higher levels.
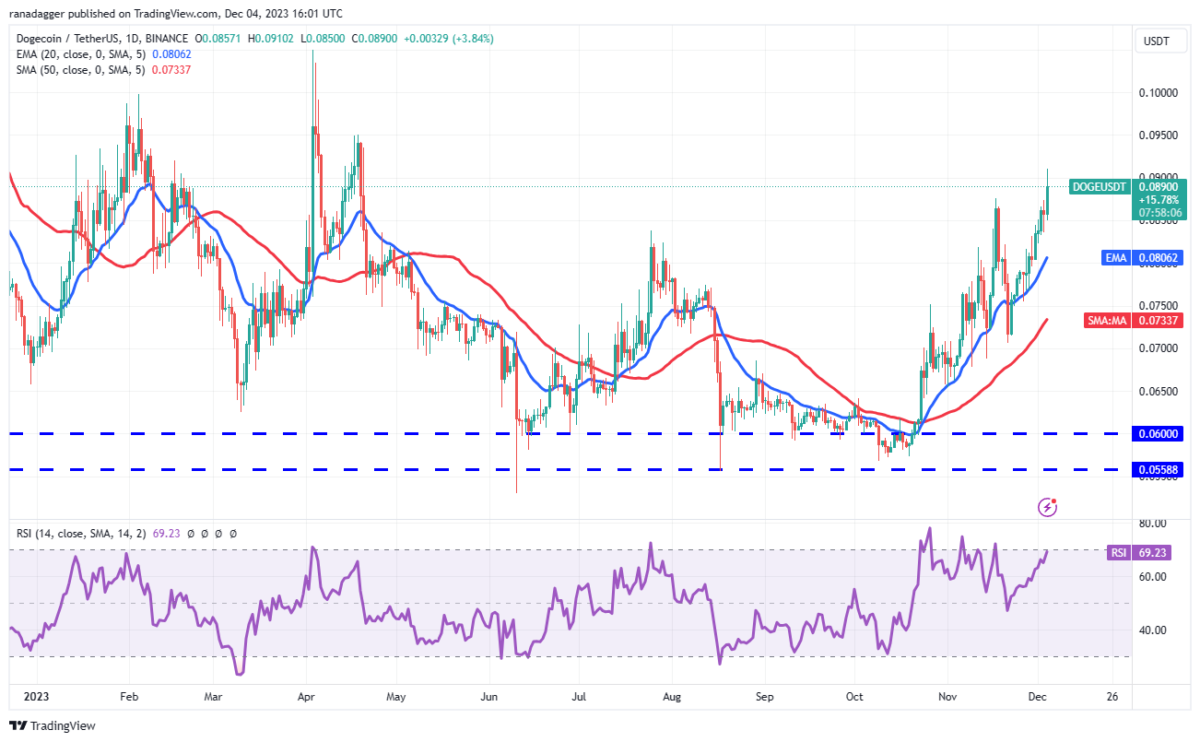
Both moving averages are sloping upwards. Also, the RSI is close to the overbought zone. This shows that the path of least resistance is upward. It is possible that the DOGE price will later rise to the psychological level of $0.10. Sellers are likely to mount a strong defense in the $0.10 to $0.11 zone. The 20-day EMA ($0.08) remains the critical level to watch on the downside. A breakout and close below this will indicate that the bulls are booking profits. It is also possible that this will reduce the DOGE price to the 50-day SMA ($0.07).
Chainlink (LINK) price analysis
LINK is in an uptrend. Buyers bought the dip, pushing the price to a local high of $16.60. This is an important level to pay attention to.
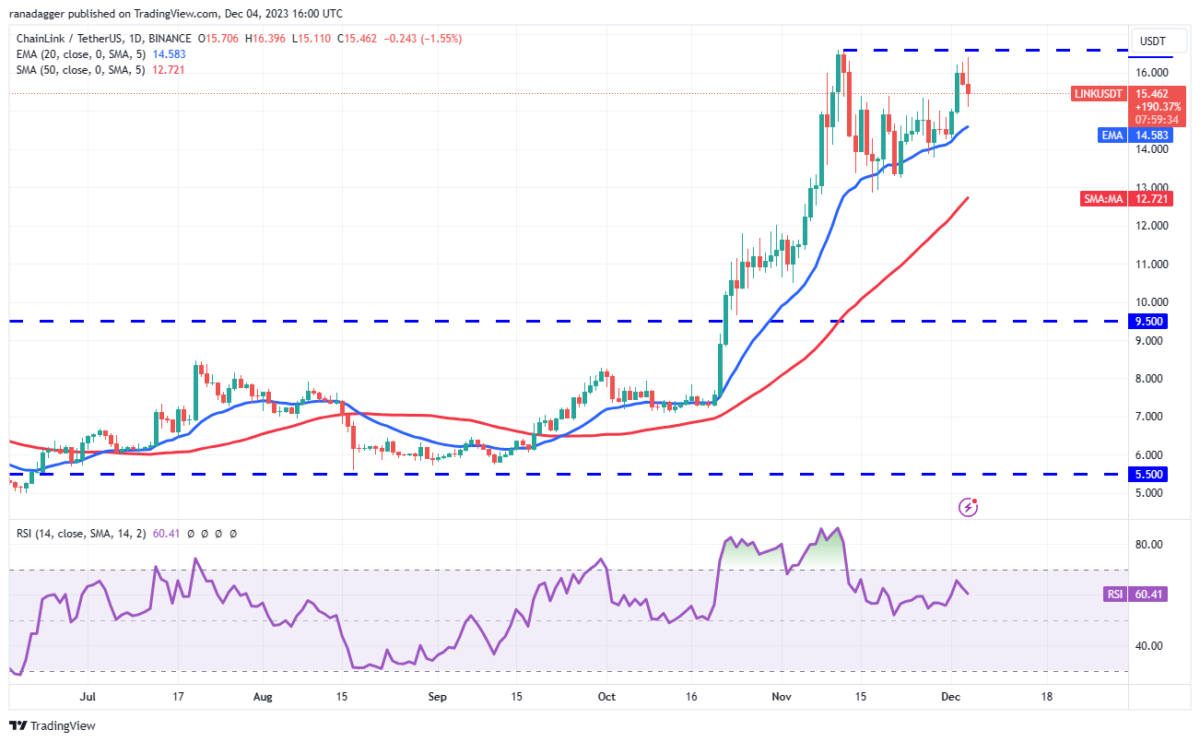
The upward sloping moving averages and the RSI in the positive zone indicate that the bulls are in command. If they push the price above $16.60, it would signal a resumption of LINK’s uptrend. LINK is then likely to make a run towards $18.30. Instead, if the price turns down from $16.60, it will indicate that the bulls remain active higher. The first sign of weakness would be a break and close below the 20-day EMA ($14.58). It is possible that this could reduce the price to $13.


 52886
52886


