
Bitcoin price aims to break out of its current range and flip to support $24,000, while altcoins are following the upward move, trying to confirm bottom patterns. Can BTC and selected altcoins rise above their respective overhead resistance levels and prolong the recovery in the short term? Analyst Rakesh Upadhyay answers with technical analysis of BTC, DOGE, SOL and 7 altcoins.
Bitcoin (BTC) price rises 4% to surpass $24,000
Bitcoin (BTC) reclaimed $22,846 on August 7 and gained momentum on August 8. Buyers pushed the price above $24,000 and they are challenging the overhead resistance at $24,668.
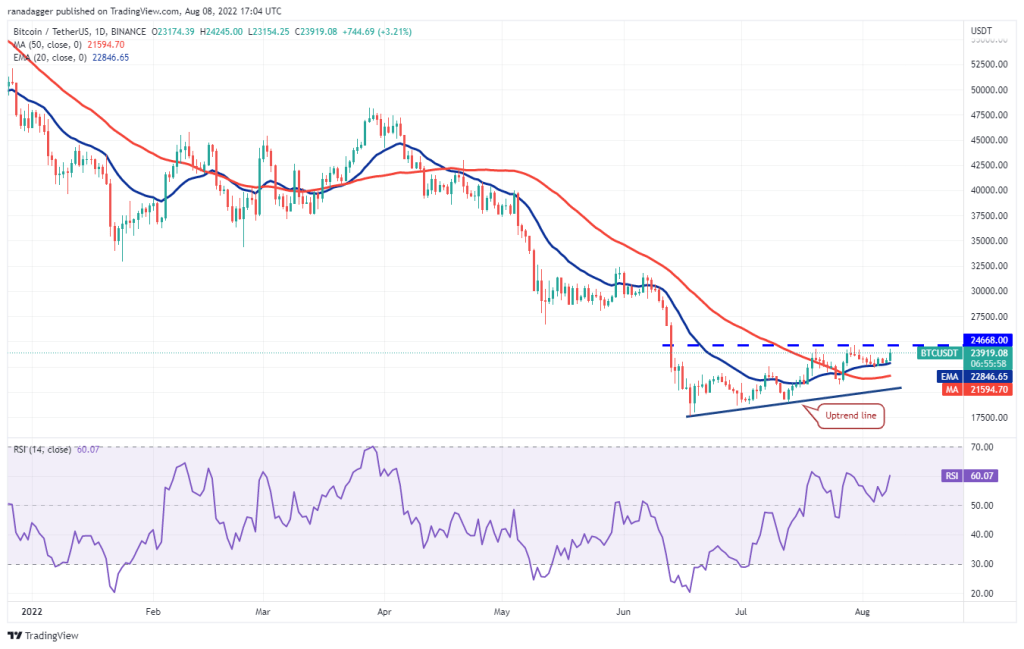
The 20-day EMA is rising and the RSI is in the positive zone, indicating that the bulls are in control. If the buyers push the price above the overhead resistance, the BTC price will pick up momentum. Also, as there is no significant resistance in between, the bulls are clear on the $28,000 path. The bears will try to stop the recovery at this level. However, if the bulls break this hurdle, the upward move points to $32,000.
Contrary to this assumption, if the price drops from $24,668, BTC will head to 22,846 at the 20-day EMA. This is an important level to watch out for. Because a break below this will provide strength for the bears to pull the price towards $21,594. A break below this level will suggest the bears will take the stage again.
Ethereum (ETH)
Buyers pushed Ethereum above the overhead resistance at $1,700 on Aug. Later, the bulls successfully defended the breakout level on August 6 and 7.
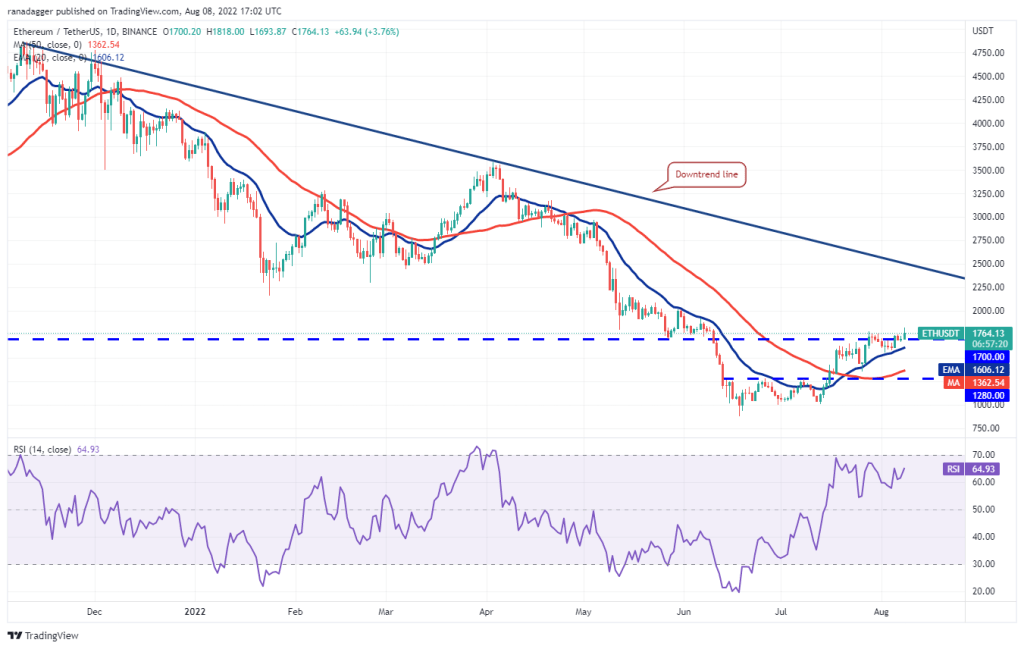
If the bulls sustain the price above $1,785, ETH bulls will take the stage again. This momentum is leading ETH price to the psychological level of $2,000. This level will also attract the selling of bears. However, if the bulls stop the next decline above $1,700, the probability of a break above $2000 increases. If this happens, EHH price may rally to the downtrend line.
This positive view will be invalidated in the short term if the price drops and breaks below the 20-day EMA ($1,606). The price could gain momentum towards $1,362 later.
BNB Coin (BNB)
BNB has reached the resistance zone between $338 and $350 where the bears are building a strong wall.
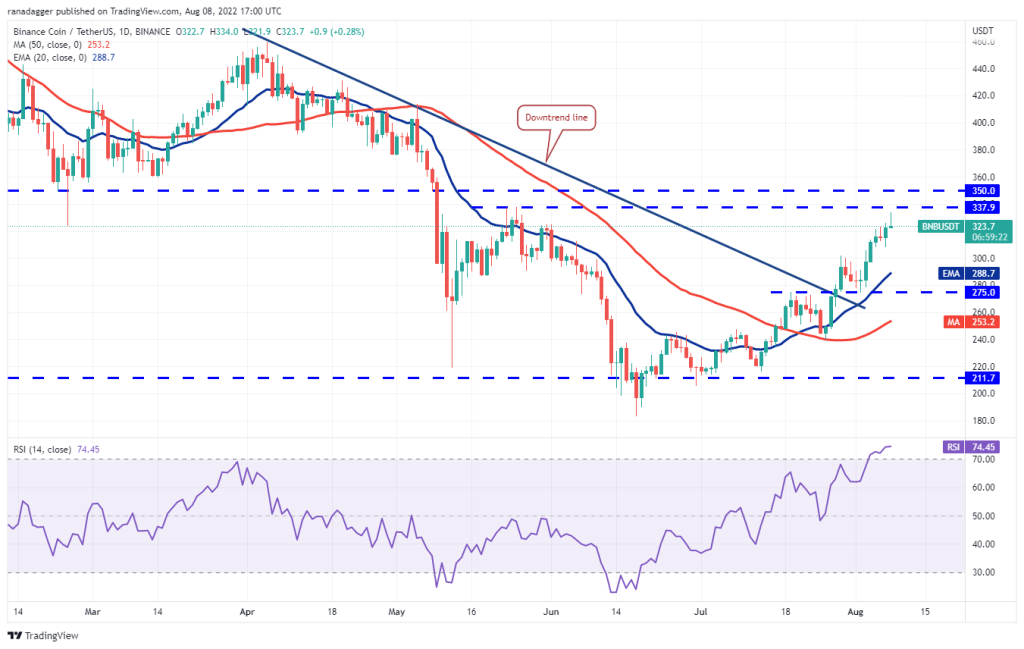
If the price drops from the current level, BNB price will head towards $289. This is an important level to consider because a strong bounce indicates that the positive sentiment is intact and investors see the dips as a buying opportunity.
The bulls will then make another attempt to clear the top zone. If they are successful, the BNB price will gain further momentum. In this scenario, the bulls are targeting $414. This positive view will be invalidated in the short term if the price drops and breaks below the 20-day EMA.
XRP
Ripple’s (XRP) price has been stuck between $0.36 and the overhead resistance at $0.39 for the past few days. Usually, such narrow gaps lead to a gap widening.
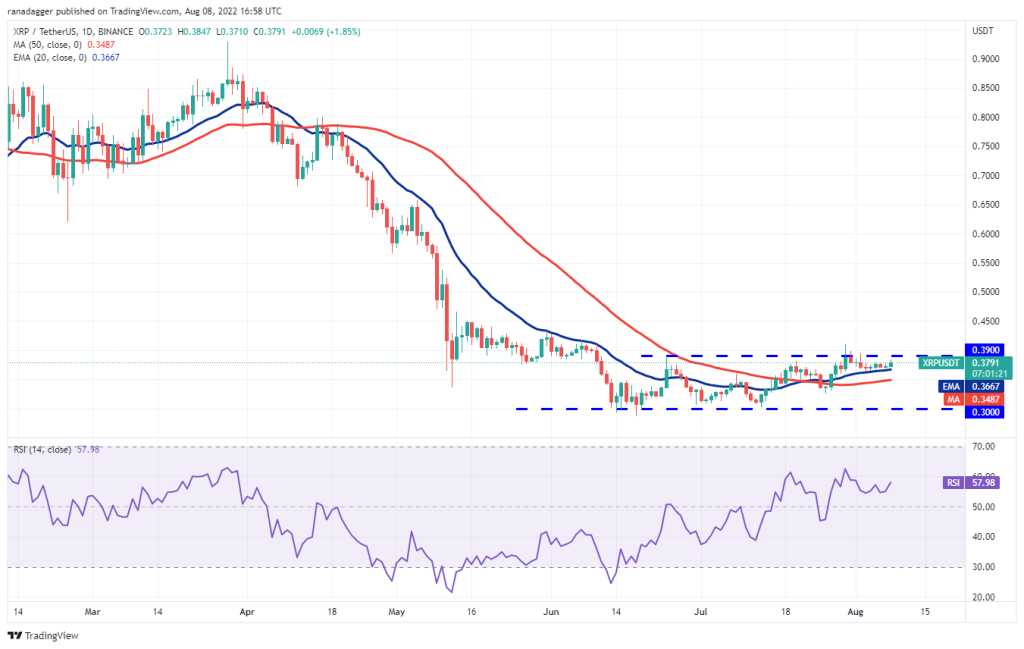
The 20-day EMA and RSI, which are rising in the positive area, point to the advantage for the buyers. If the bulls hold and sustain the price above $0.39, it will suggest the start of a fresh upward move. XRP will then head towards $0.48 and then $0.54.
This positive view will be invalidated in the short term if the price drops and breaks below the 20-day EMA. XRP could then drop to the 50-day SMA ($0.35). Such a move suggests that XRP may spend some more time in the range.
Cardano (ADA)
Cardano (ADA) bounced off $0.50 on August 5 and hit the strong overhead resistance at $0.55.
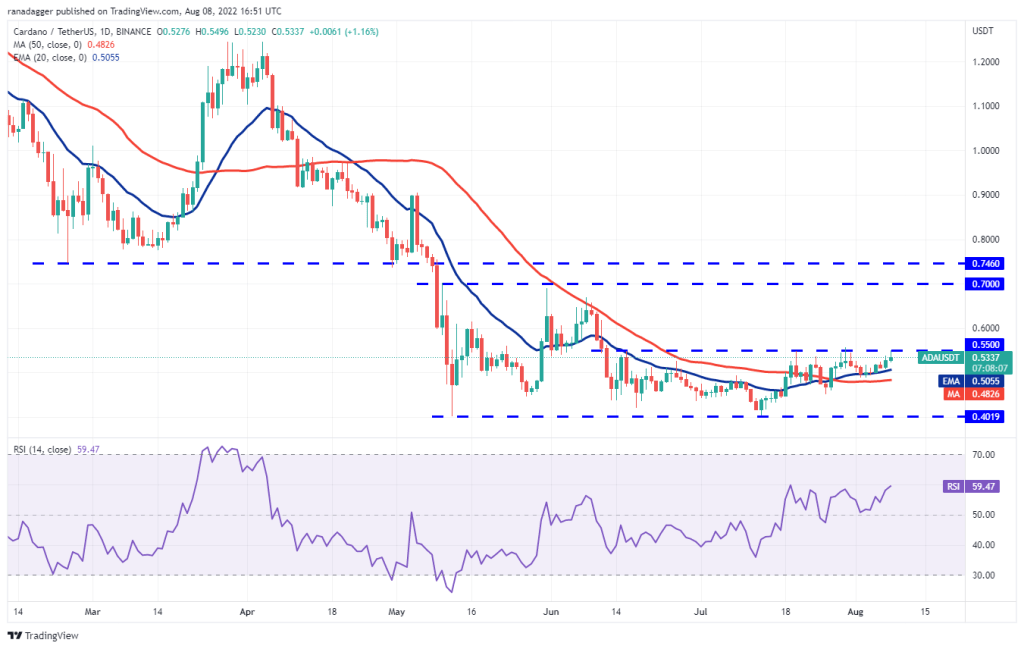
On the technical side, the 20-day EMA is rising and the RSI is in the positive territory. This indicates that the path of least resistance is up. If buyers push the price above $0.55, the ADA price will begin the upward march to $0.63 and then $0.70. The bears are preparing for a strong challenge at this level.
To invalidate this positive view, the bears will need to push and sustain the price below the 50-day SMA. As a result, it could extend the ADA’s stay between $0.40 and $0.55 once again.
Left (LEFT)
Solana (SOL) broke above $40 on Aug. Thus, the bulls thwarted the bears’ attempts to push the price back below the level. Buying resumed on August 8 and the bulls will attempt to push the price towards the overhead resistance at $48.
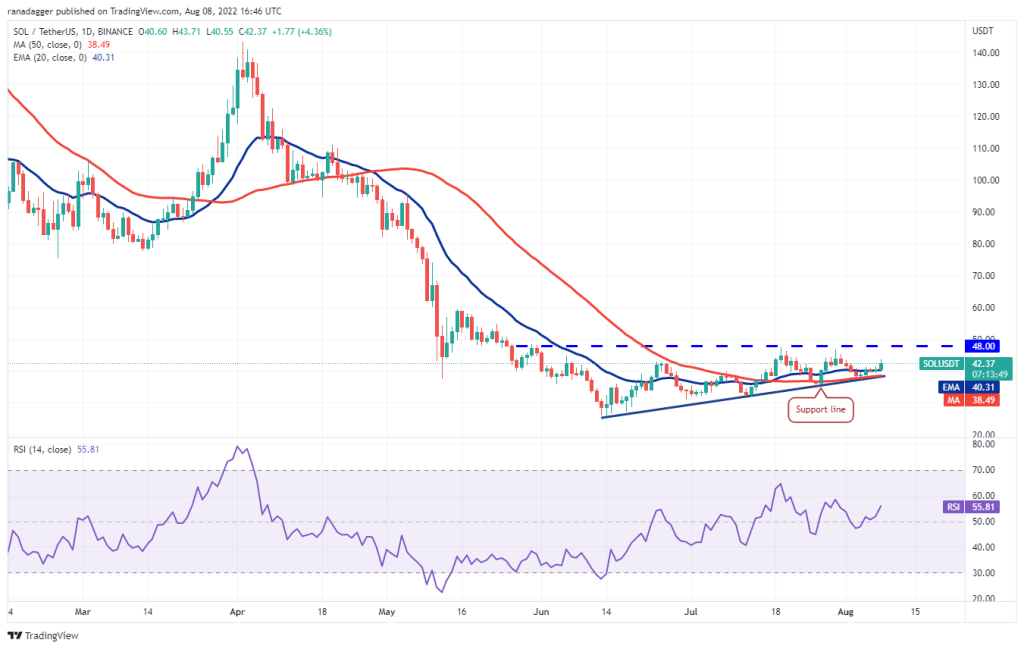
The 20-day EMA is gradually rising and the RSI is in the positive zone, indicating that the bulls have prevailed. If buyers push the price above $48, the ascending triangle pattern will be complete. SOL price will then prepare for a rally to $60 and then to the formation target at $71.
Alternatively, if the price drops from $48, as in the previous two cases, it indicates that the bears are defending the level aggressively. This could keep the SOL price inside the triangle for a few more days. The bullish setup will be invalid on a break below the support line.
Dogecoin (DOGE)
Dogecoin (DOGE) jumped from $0.07 on August 7. This shows that the bulls are vigorously defending the moving averages. However, the long wick on the August 8 candlestick indicates that the bears are selling higher.
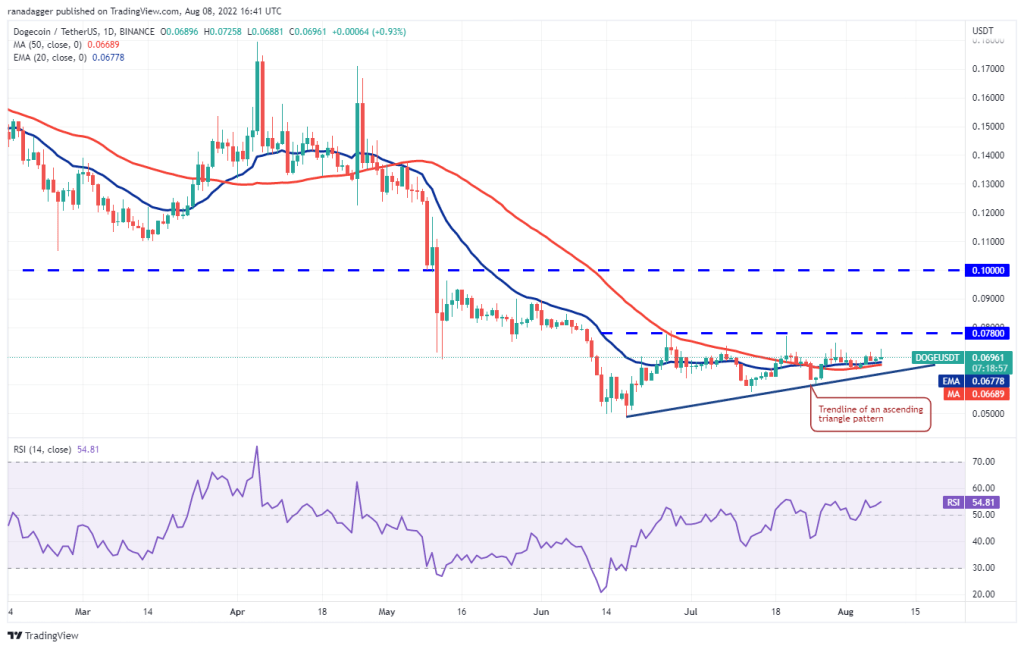
The flat moving averages indicate a balance between supply and demand, while the RSI in the positive territory indicates a slight advantage for buyers. If the bulls propel the price above the overhead resistance at $0.08, they will complete the ascending triangle pattern. DOGE price will then prepare for a rally towards psychological resistance at $0.10.
Conversely, DOGE price could stay inside the triangle for a few more days if the price breaks through the overhead resistance. The bears will need to push the price below the trendline to invalidate the bullish setup.
Polkadot (DOT)
Polkadot (DOT) bounced back from overhead resistance at $9 on Aug. However, the bulls did not surrender to the bears. They continued their purchases on August 7 and pushed the price above the overhead resistance on August 8.
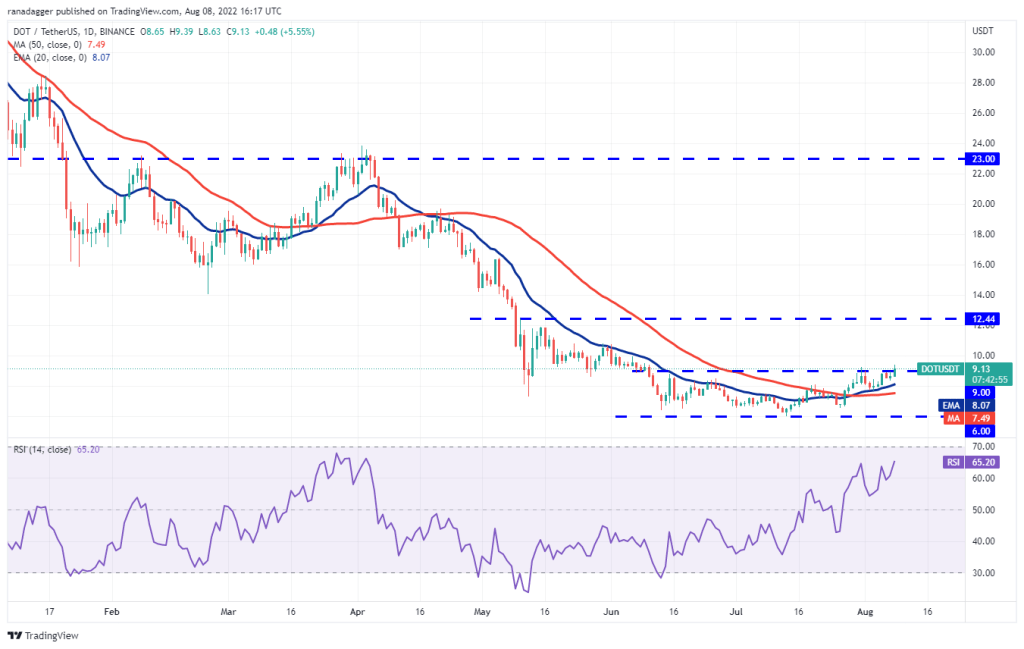
The 20-day EMA is rising and the RSI is in the positive zone, indicating the bulls have prevailed. If buyers hold the price above $9, the bullish momentum could increase and the DOT price could rally to $10.80 and later to $12. Contrary to this assumption, if the price drops and dips below $9, it would suggest that a breakout could be a bull trap. The DOT will then head towards $8.07 and then $7.49.
Polygon (MATIC)
MATIC formed a Doji candlestick pattern on August 7, which turned up on August 8. This indicates that the bulls are buying dips to the 20-day EMA ($0.86).
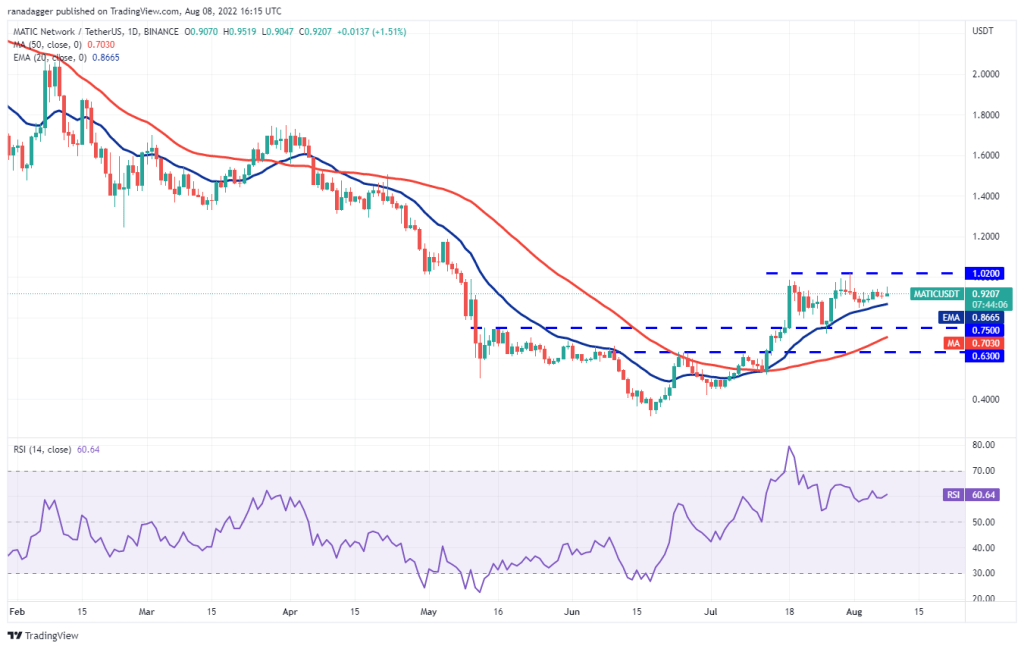
The rising moving averages and RSI in the positive zone are giving buyers an edge. According to the analyst, MATIC will head towards the overhead resistance at $1.02, where the bears can form a strong defense. Also, if the bulls don’t give up above $1.02, a break above it will become more likely. MATIC will then gain momentum to $1.26 and then $1.50. The first sign of weakness will be a break and close below the 20-day EMA. This opens the doors for a possible drop to $0.75.
Avalanche (AVAX)
AVAX broke above the strong overhead resistance at $26.38 on August 6 and closed. This indicates the completion of the ascending triangle formation.
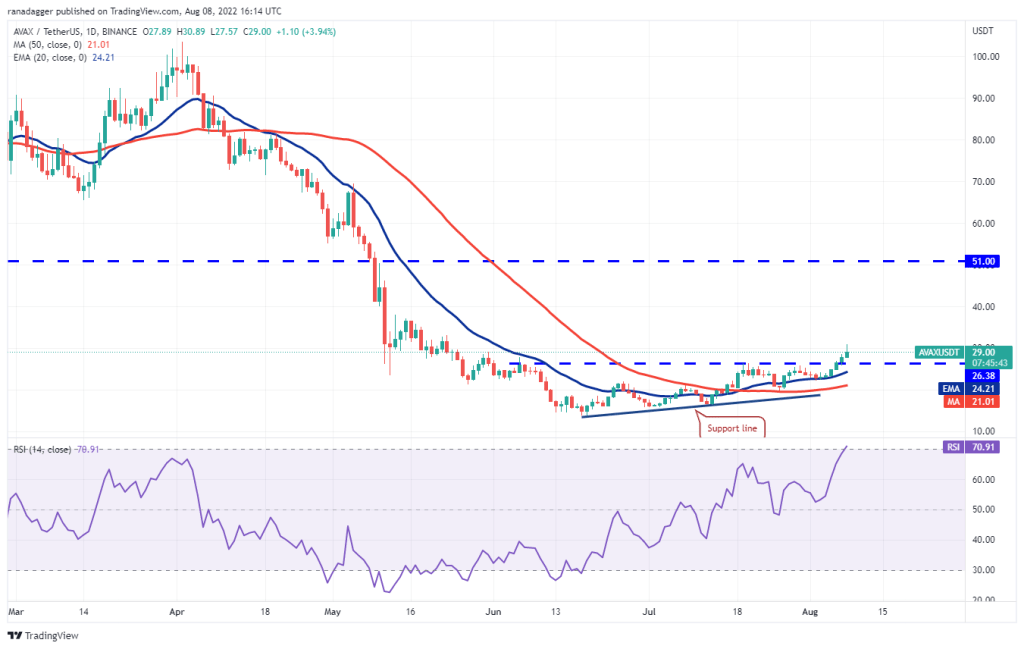
According to the analyst, AVAX is heading towards the $33 and then $39.05 pattern target. The rising moving averages point to the advantage for buyers, while the RSI has moved into the overbought territory, suggesting a minor correction in the near term. If the bulls turn the $26.38 level during the next correction, it will signal a potential trend change. This positive view will be invalidated in the short term if the price drops and falls below the moving averages.


 4675
4675


