
According to crypto analyst David, Maker is likely to continue rising in the near future. Analyst Valdrin Tahiri says MATIC is starting to show bullish signs. Additionally, the analyst expects another rise for BCH and one altcoin.
MKR price prediction: Altcoin will see a sharp rise!
The price of Maker (MKR) reached a yearly high of $1,380 in early August. However, the altcoin has been declining since then. During this time, the price dropped as low as the previous long-term resistance level at $980. However, the token recovered thereafter.
There are long wicks below all three candles (green arrows) reacting to the $980 level on a weekly basis. This is a sign that the bulls are buying aggressively as the price falls into this zone. The weekly RSI (Relative Strength Index) is above 50. Additionally, it shows an upward structure that supports the continuation of the bull trend. If the upward momentum continues, it is possible for the altcoin price to rise to the next resistance level at $1,660.
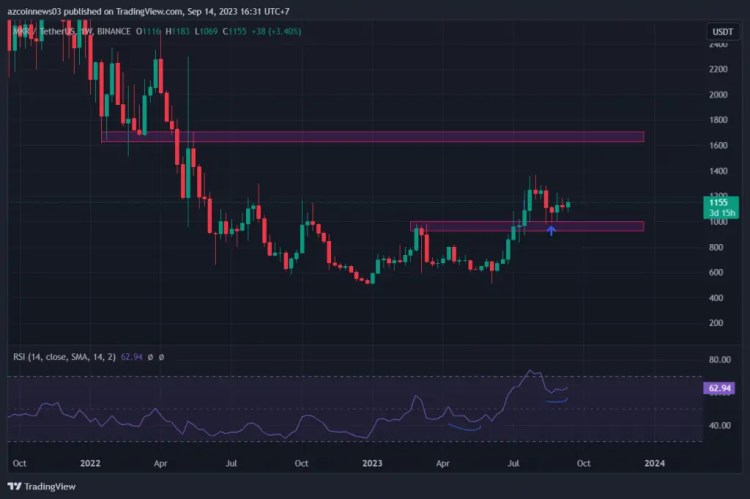
Technical indicators show that the altcoin price will continue to rise in the near future. The nearest target is $1,380. However, MKR has the potential to reach $1,660. This view will be invalidated if MKR price breaks below the $980 support level.
MATIC price prediction: There is an uptrend after seeing the bottom!
A closer look at the Elliott Wave count on the daily time frame analysis reveals a bearish outlook for MATIC. But it also shows that it will soon reach a bottom. The most likely scenario sees MATIC currently in the fifth and final phase of a downtrend that began in February. The shape of the fourth wave strongly supports this interpretation.
The fourth wave was trapped within a parallel ascending channel, a common feature in corrective movements. Moreover, the top of the fourth wave briefly broke through the horizontal level at $0.80 (red circle), which later turned into a resistance level. If the downtrend continues, MATIC’s price is expected to complete its fifth and final wave around $0.41, corresponding to the 1.27 outer Fibonacci retracement level of the fourth wave. This target is above the key horizontal support area at $0.34.
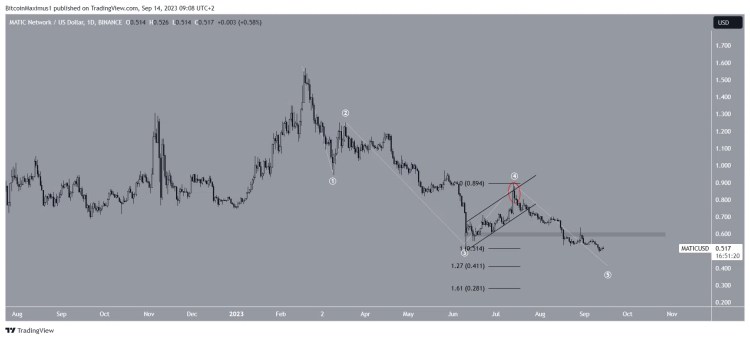 MATIC Daily Chart. Source: TradingView
Therefore, the most likely prediction for MATIC’s price is a drop to $0.40. However, this is likely to be followed by a significant rise. However, if the altcoin manages to regain the $0.60 level, it will indicate that it has reached the bottom. In this case, a 63% rally towards the next resistance at $0.84 is potentially possible.
BCH price prediction: wave count shows bottom
A closer analysis of the daily time frame provides a mostly bullish outlook. This is due to both price movements and Elliott Wave Counting. The wave count shows that BCH has begun its fifth and final wave (white) of its uptrend. The fifth wave began after BCH bounced off the 0.618 Fib retracement support level at $180 on August 17 (green icon).
If the count is correct, the altcoin price will reach a high between $375 – $425. This area is a horizontal support area. Additionally, this area was formed by the 1.61 Fib extension of the fourth wave (black). A breakout from a descending parallel channel containing fourth wave moves is supporting this count. Therefore, the most likely future move would be a move to the $375-$425 region. This means an average increase of 100% from the current price.
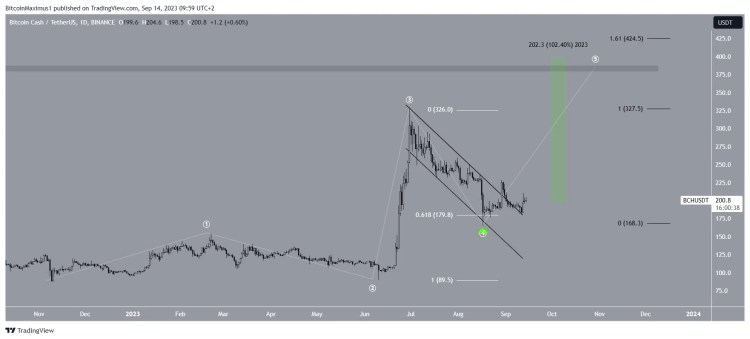 BCH Daily Chart. Source TradingView
Despite the bullish price prediction for BCH, failure to sustain the increase could lead to a 25% decline in the $150 horizontal support area. In this case, the bullish prediction becomes invalid.
ADA price prediction: Will the altcoin reclaim the horizontal support level?
Similar to the daily time frame, the six-hour chart provides mixed data. First, price action shows both bullish and bearish signs. While ADA broke out of the short-term descending resistance line, it is still trading below the minor $0.25 horizontal area. It needs to regain it to consider an uptrend. RSI is also showing mixed signals. The indicator is rising and has created a bullish divergence. However, it has not yet broken above 50, which is necessary to confirm the trend as bullish.
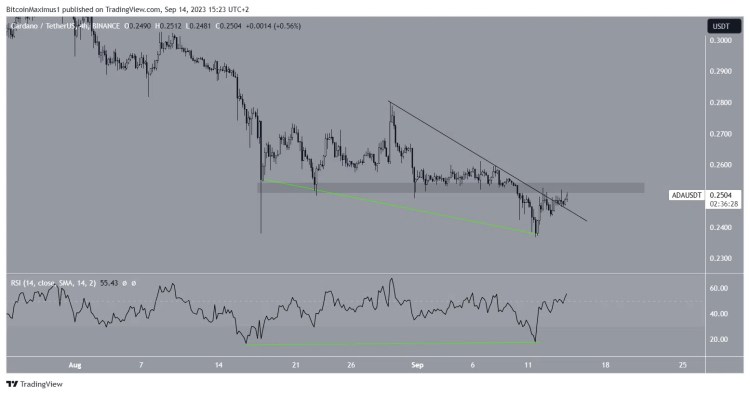 ADA Six-Hour Chart. Source: TradingView
Therefore, the future ADA price prediction will determine whether the price breaks out of the channel and the $0.26 area or is rejected. In the event of a breakout, a 30% increase could occur. However, a 20% drop is possible if the altcoin price rejects.
The opinions and predictions in the article belong to the analysts and are definitely not investment advice. As Kriptokoin.com, we recommend that you do your own research before investing.


 46253
46253


