
Bitcoin is witnessing profit booking by short-term holders. However, institutional investors continue to invest money in BTC investment products. Can Bitcoin continue its rise and reach $48,000, or will profit booking begin? What will the leading altcoins, including AVAX, do on the other side? Crypto analyst Rakesh Upadhyay examines the technical outlook of the top 10 cryptocurrencies to find out?
An overview of the cryptocurrency market
As you follow from Kriptokoin.com, Bitcoin has dazzled with an increase of over 10% this week. This shows that investors are urgently scrambling to buy Bitcoin as they expect the price to rise further. CoinShares data shows investors have invested more than $1.44 billion in Bitcoin investment products over the past ten weeks. The expectation is that approval of a spot Bitcoin ETF will attract large investments. Animoca Brands CEO Robby Yung said in a speech at the Next Block Expo conference in Berlin that Bitcoin ETFs could generate “$10 to $12 billion” in potential revenue.
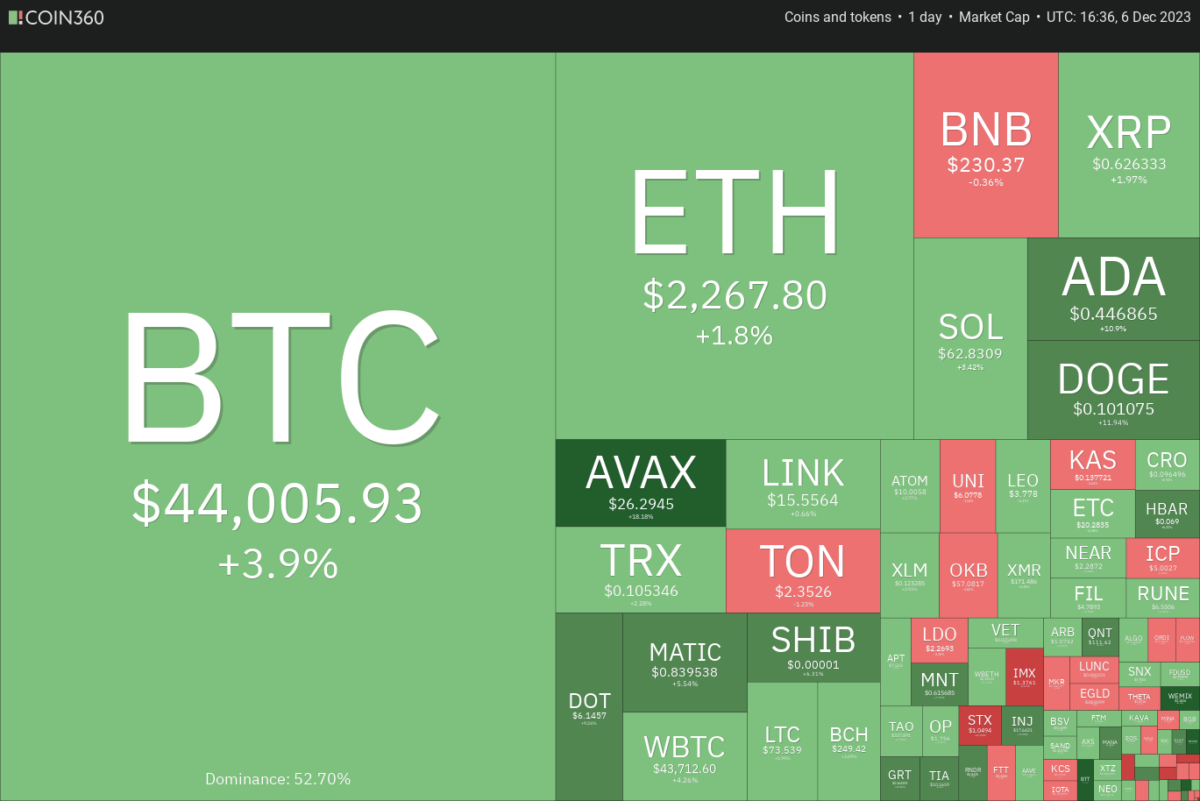 Daily cryptocurrency market performance. Source: Coin360
While long-term investors were accumulating Bitcoin, short-term investors (STHs) who had been holding the coin for 155 days or less were busy taking profits in December. Analyst James Van Straten said profit-making STHs sent approximately $5 billion worth of Bitcoin to exchanges in the first four days of December.
BTC, ETH, BNB, XRP and SOL analysis
Bitcoin (BTC) price analysis
Bitcoin is in a strong uptrend. The momentum picked up after the bulls pushed the price above $40,000. It easily cleared the minor resistance at $41,160. The rally over the last few days has sent the relative strength index (RSI) into overbought territory. This usually initiates a correction or consolidation. But the bulls are in no mood to slow down. Buyers will try to push BTC to the $48,000 target. This will likely act as a formidable resistance.
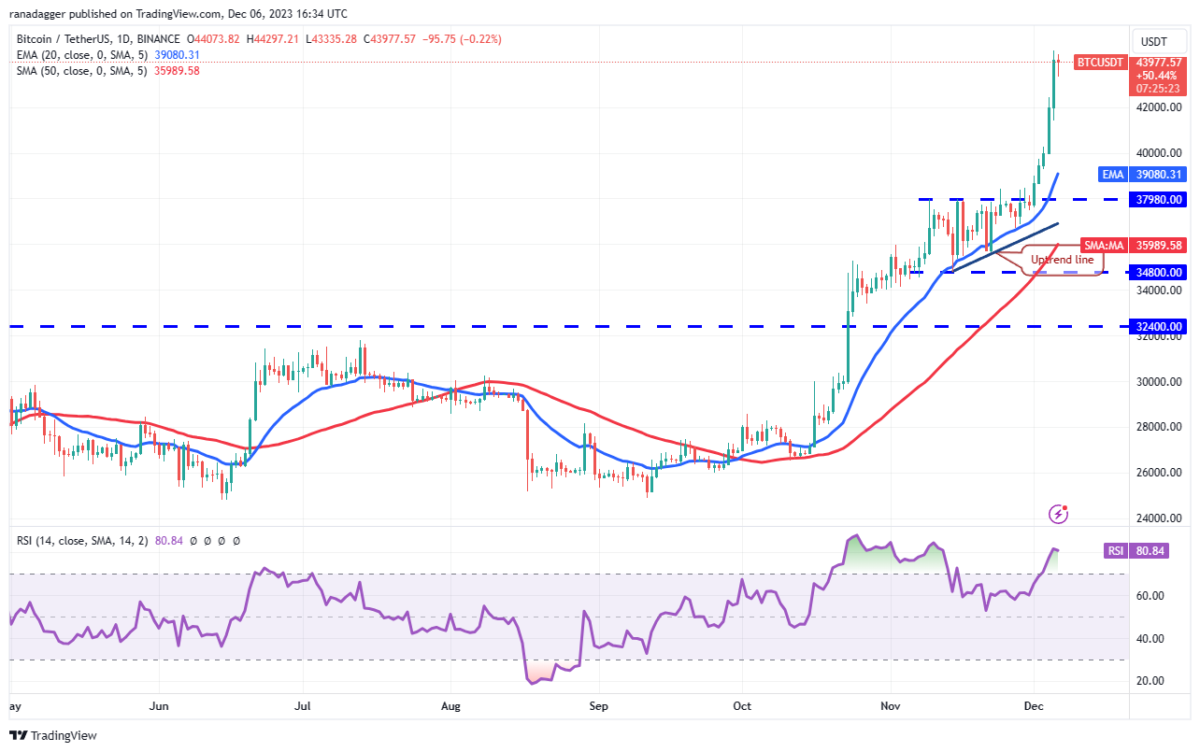
Any decline from the current level is likely to find support at the 20-day exponential moving average ($39.0803). A break below this level would be the first sign that traders are rushing for the exit. It is possible that this marks the beginning of a short-term corrective phase.
Ethereum (ETH) price analysis
The Ethereum long tail on the December 5 candlestick shows that the bulls are thwarting the bears’ attempts to push the price below the $2,200 breakout level. The upward sloping moving averages and the RSI in the overbought zone signal that the bulls are in command.
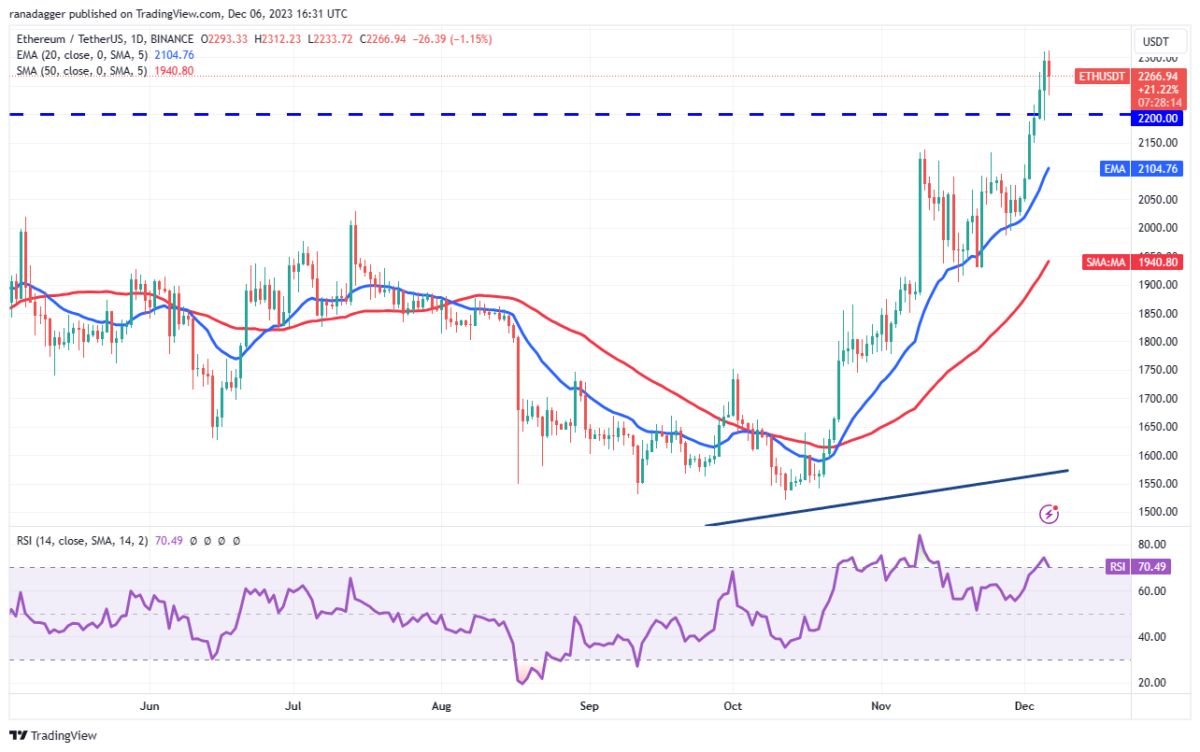
The break above $2,200 completed an ascending triangle pattern that could start a rally towards $2,500 and then to $2,950. On the other hand, the bears will try to sink the price below $2,200 and trap the aggressive bulls. It is possible that ETH could then slide towards the 20-day EMA ($2,104). A break and close below this support could open the doors for a decline to the 50-day SMA ($1,940).
Binance Coin (BNB) price analysis
Bears are trying to defend the moving averages. But the bulls did not give up much ground. This suggests that BNB could rise to $239.20. 20-day flat EMA ($232). Also, the RSI is just below the midpoint. This indicates that there is a balance between buyers and sellers.
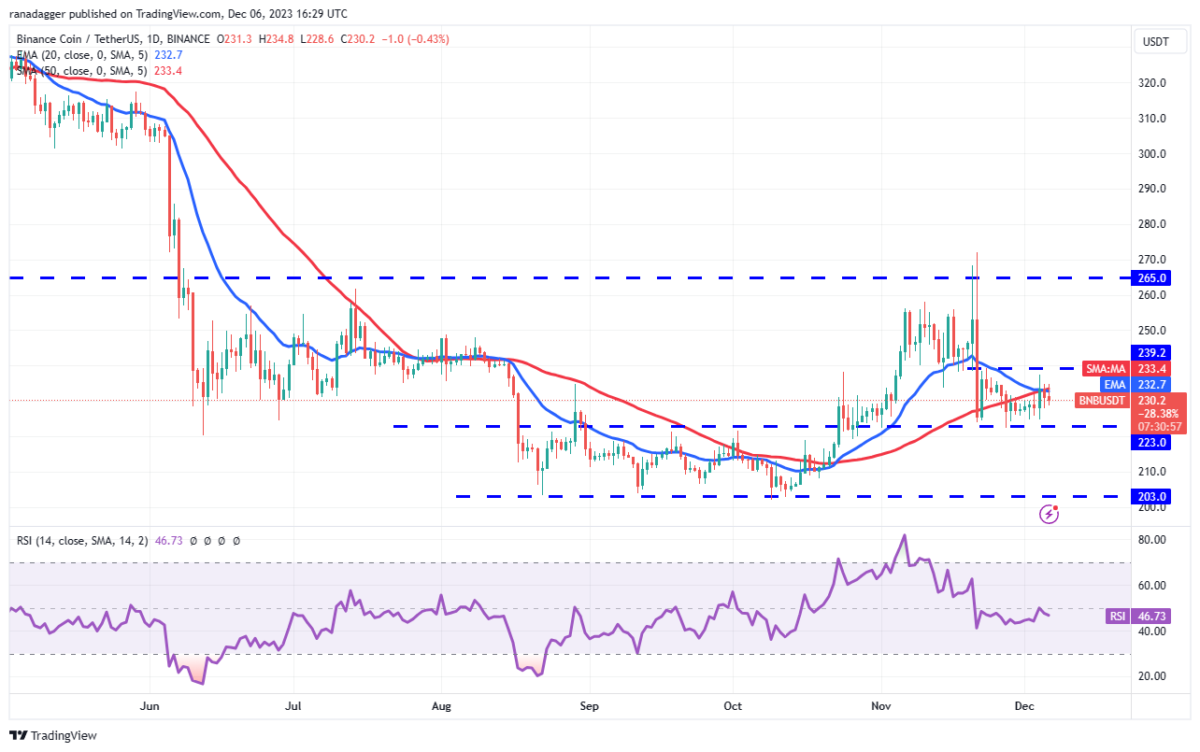
If the price declines sharply from $239.20, the range-bound move could continue for a while. On the other hand, a break above $239.20 will shift the advantage in favor of the bulls. It is possible that BNB then rises to the overhead resistance of $265. Sellers will take control if they push the price below $223. This is likely to start a decline towards $203.
Ripple (XRP) price analysis
The bears attempted to push XRP below the 20-day EMA ($0.62) on December 4 and 5. However, the long tail on the candlestick indicates solid buying at lower levels. While the bulls will try to push the price towards $0.67, the bears will try to stop the up move at this level.
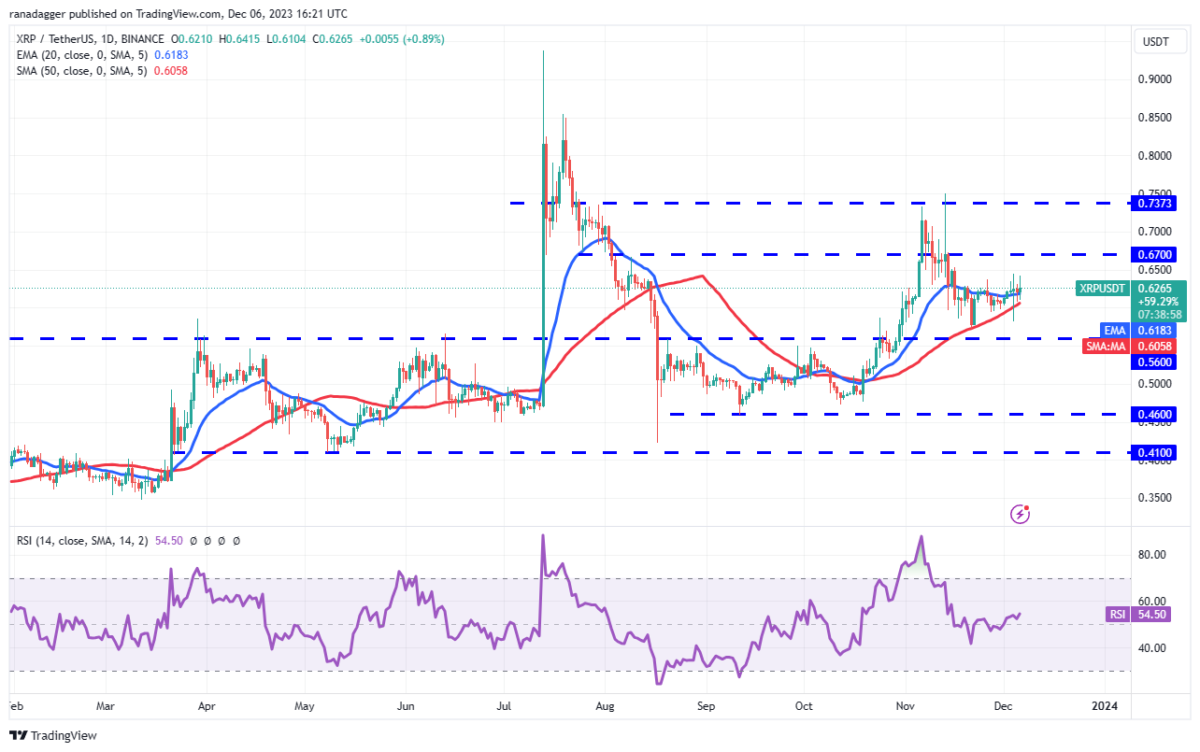
On the way down, if the price recovers from the 20-day EMA, it will increase the possibility of a rise to $0.74. Sellers will attempt to defend this level aggressively. Additionally, it will try to keep XRP in the range between $0.56 and $0.74 for a while longer. Meanwhile, the bears are likely to have other plans. The bears will try to push the price below the moving averages. Thus, they will challenge the $0.56 support.
Solana (SOL) price analysis
SOL is consolidating in an uptrend. The bears attempted to push the price below $59 on December 5, but the bulls held their ground. This shows that the bulls are trying to turn the level into support.
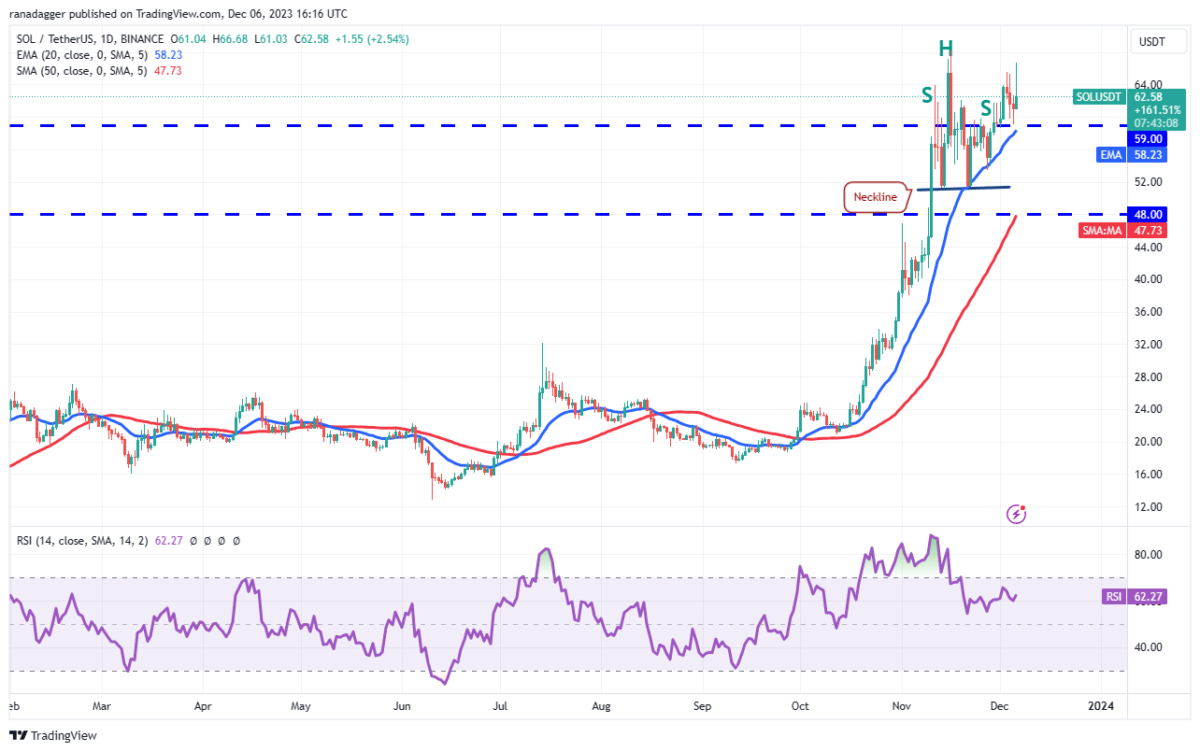
The bulls will try to strengthen their position further by pushing the price above $68.20. If they do this, they will invalidate the head-and-shoulders formation. The failure of a bearish formation is a bullish sign as the early bears rush to close their positions, causing a short squeeze. It is possible that this could push SOL towards $100. Alternatively, if the price declines sharply from $68.20, it would indicate that the bears are active higher. The bears will then try to sink the price below the 20-day EMA. If they are successful, SOL is likely to drop as low as $51.
ADA, DOGE, AVAX, LINK and TONE analysis
Cardano (ADA) price analysis
ADA’s close above the $0.40 resistance on December 4 shows that the uncertainty of the last few days has been resolved in favor of the bulls.
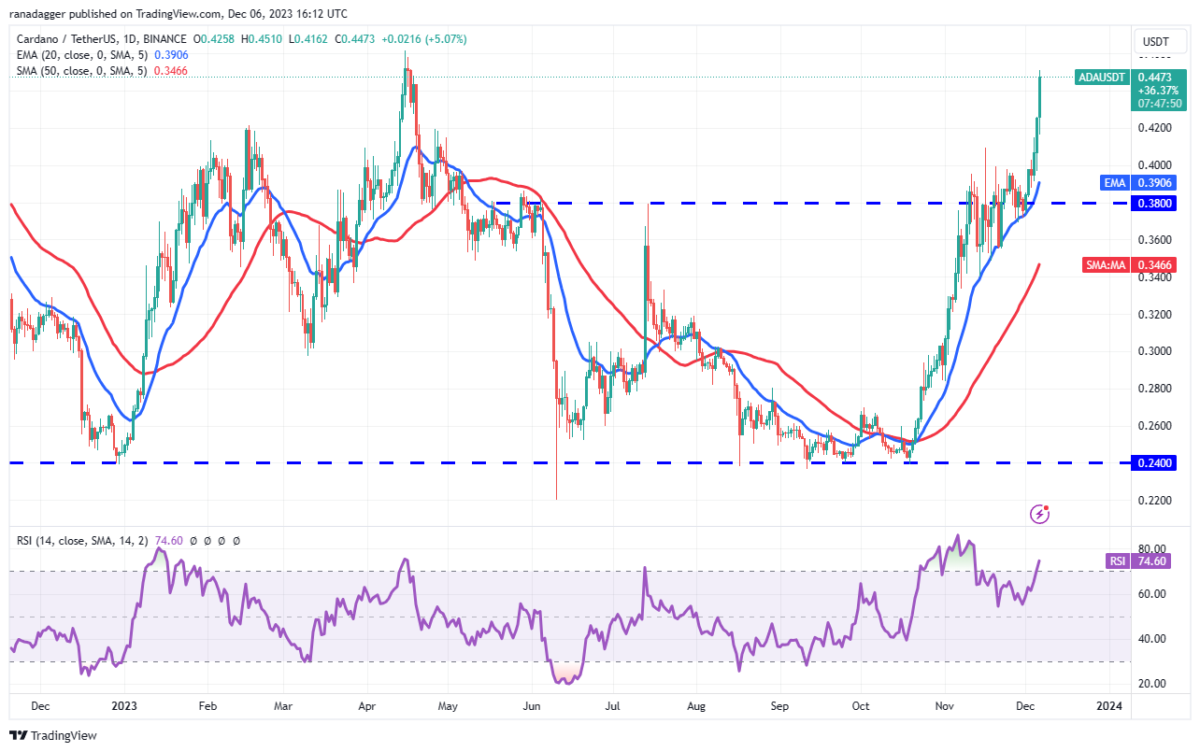
ADA will likely rise to $0.46, where resistance will form. If the price declines from this level but does not settle below $0.40, it will increase the chances of an upside breakout. It is possible that ADA could then jump to $0.52. The first sign of weakness would be a drop below $0.40. This would indicate that markets are rejecting higher levels. The bears will gain further strength if they push the price below $0.38. It is possible for ADA to drop to $0.34 later.
Dogecoin (DOGE) price analysis
DOGE is in an uptrend. The bulls pushed the price above the minor resistance at $0.09 on December 4. This was followed by a move above the $0.10 resistance on December 6. The sharp rise in the last few days has pushed the RSI deep into the overbought territory. This increased the risk of a short-term pullback or consolidation.
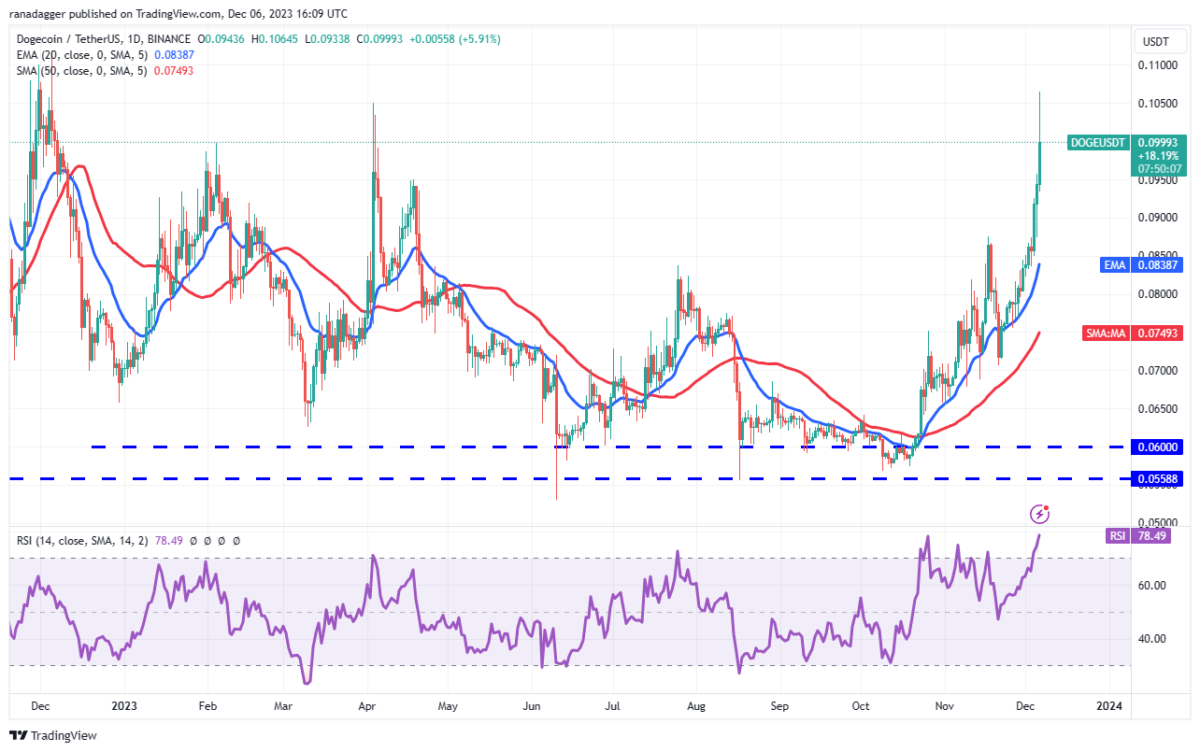
If buyers do not allow the price to fall below $0.09, the possibility of a rise to $0.11 increases. The bears are expected to defend the $0.11 level with all their might. Because if it exceeds this level, it is possible for DOGE to rise up to $0.16. Conversely, if the price declines and breaks below $0.09, DOGE could swing in the wide range between $0.11 and $0.06.
Avalanche (AVAX) price analysis
AVAX price bounced off the 20-day EMA ($21.29) on December 4. This showed that the upward trend continued and investors were buying on dips. Purchases for AVAX continued on December 5. Moreover, the bulls pushed AVAX price above the overhead resistance at $24.69. This paves the way for a potential rally to $28.50 and then to $31.
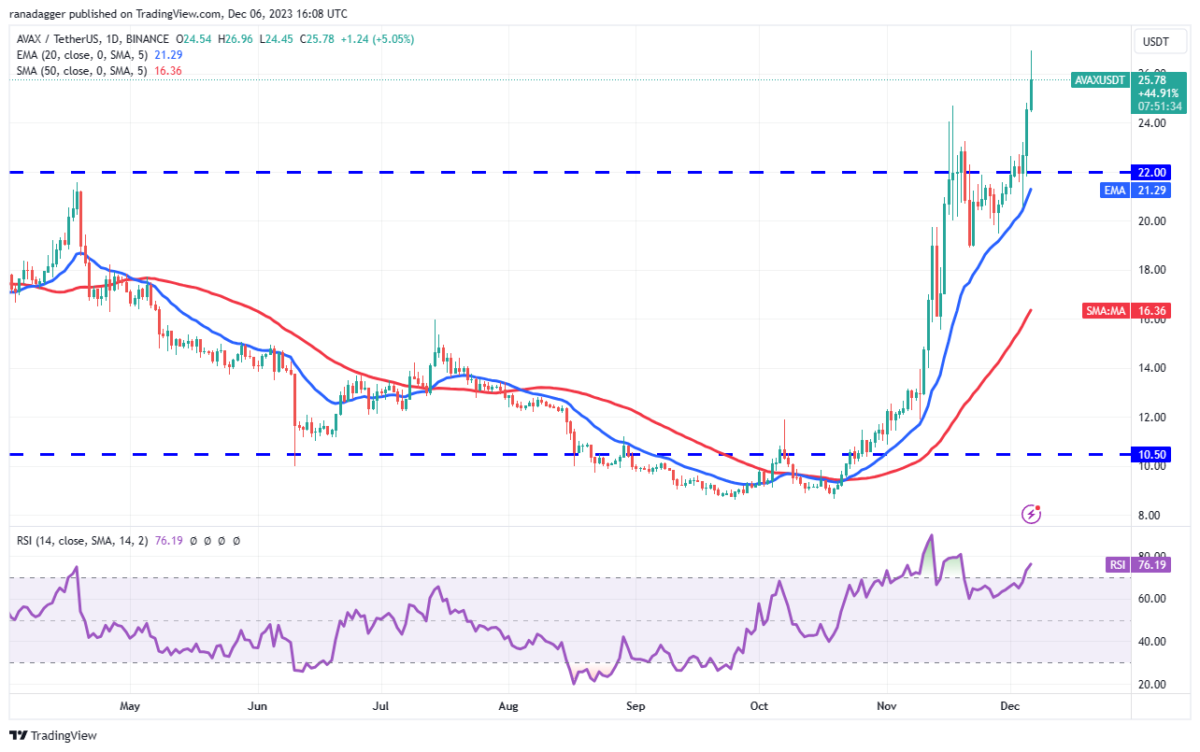
The Bears are expected to play strong defense at this level. Time is running out for AVAX bears. If they want to prevent the upside move, they will have to push the AVAX price below the $22 breakout level. Such a move could trap aggressive bulls and result in a long liquidation. It is possible that AVAX price may drop to $18.90 later.
Chainlink (LINK) price analysis
LINK has been trading near the overhead resistance at $16.60 for the past few days. This shows that the bulls are holding their positions because they are expecting an upward break. The 20-day EMA ($14.79) is sloping up and the RSI is above 60. This indicates that there is a high probability of an upward break.
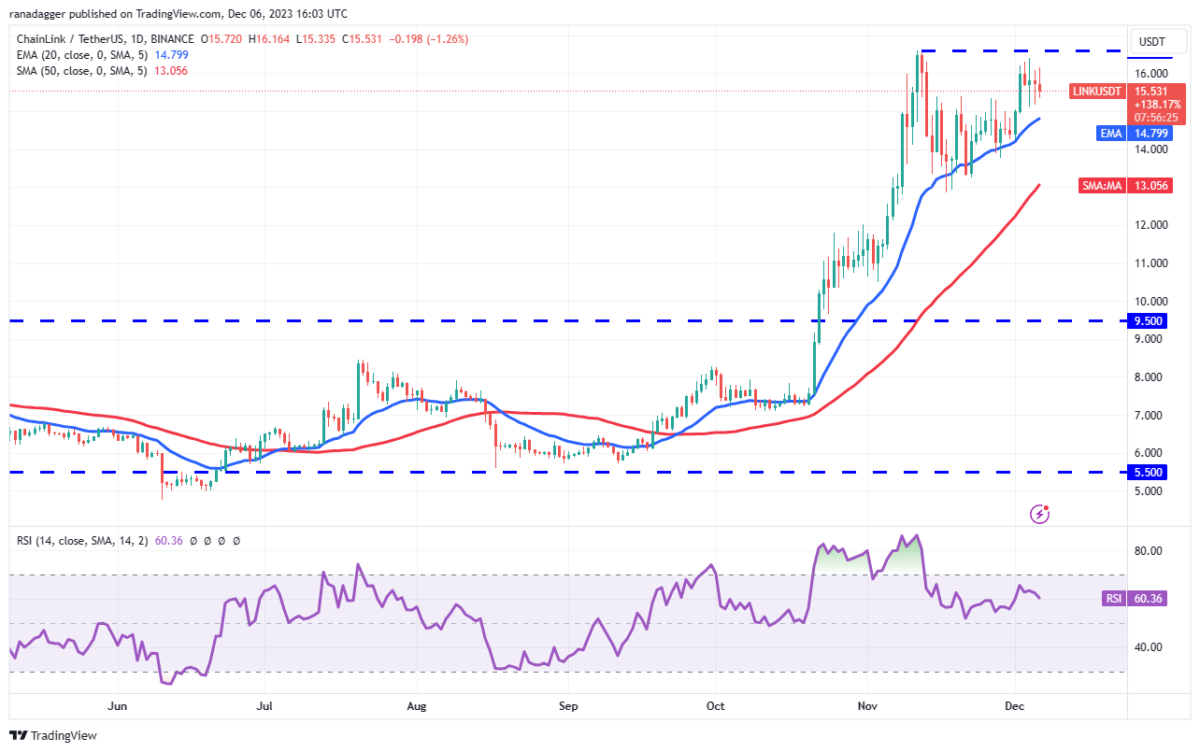
If it breaks above $16.60, it is possible that the bullish momentum will increase. Thus, it is possible for LINK to reach $18.30. If the bears want to stem the rise, they will need to quickly push the price below the 20-day EMA. This is likely to push LINK lower to the 50-day SMA ($13.05). This level is again likely to attract aggressive buying by the bulls.
Toncoin (TON) price analysis
TON has been trading near the 20-day EMA ($2.39) for the past few days. This indicates a lack of demand at higher levels. The 20-day EMA is flattening out and the RSI is just below the midpoint. This shows that there is a balance between supply and demand.
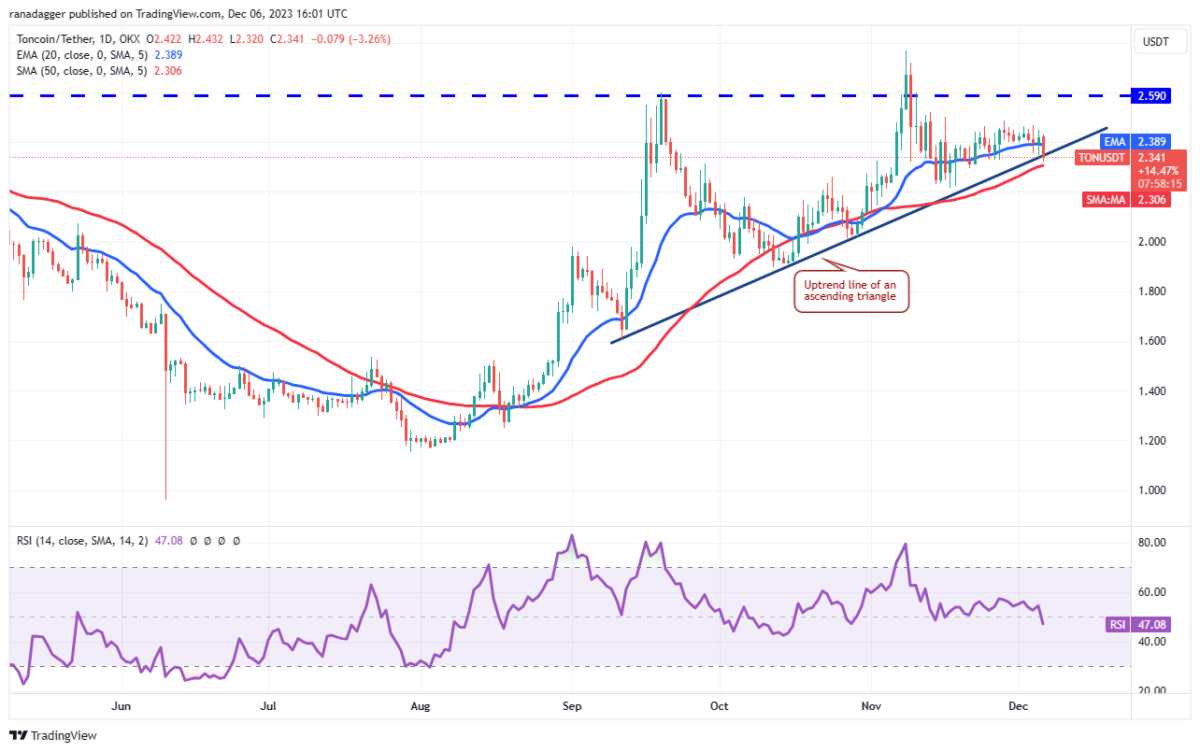
If the price breaks below the 50-day SMA ($2.30), it is possible that TON could decline as low as $2. On the upside, the bulls will need to push the price above the $2.52 to $2.59 resistance zone to gain the upper hand. If they are successful, TON will complete the ascending triangle formation with a target target of $3.58.


 41995
41995


