
Bitcoin price formed a bottom above $35,000 and started a fresh increase against the US Dollar. BTC broke the $38,000 resistance and even traded close to $40,000. According to technical analysis by NewsBTC’s Aayush Jindal:
- Bitcoin started a fresh increase above the $38,000 and $38,500 resistance levels.
- The price is currently $38,000 and is well above the 100 hourly simple moving average.
- There was a break above a major bearish channel with resistance near $36.200 on the hourly chart of the BTC/USD pair (data from Kraken).
- The pair might correct, but the bulls are likely to remain active around $38,000.
Bitcoin (BTC) Price Gains Upward Acceleration
BTC formed a bottom above the $35,000 level and recently started a strong increase.
There was a clear break above the $500 resistance and the 100 hourly simple moving average. More importantly, there was a break above a major bearish channel with resistance near $36,200 on the hourly chart of the BTC/USD pair.
The pair gained momentum and broke the key $38,000 resistance level. The upward move caused the price to trade close to the $40,000 level.
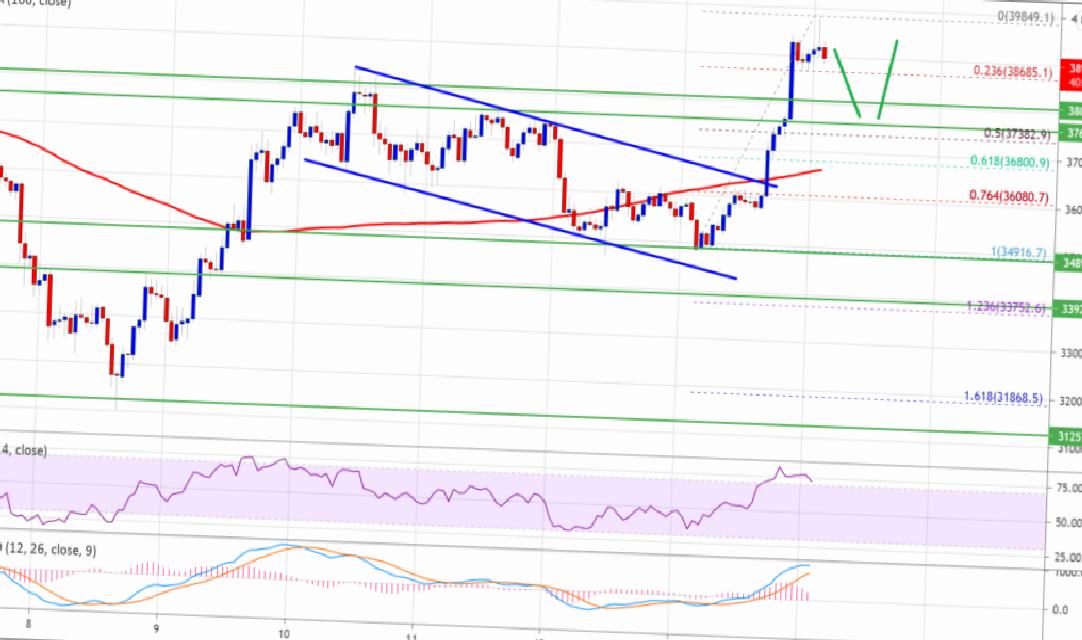
Price traded as high as $39,849 and is now trading lower. An immediate support is near the $38.650 level. This is 23% of the bullish wave from $34,916 to $39,849. Close to 6 Fib retracement level.
The first major resistance on the upside is near the $39,800 and $40,000 levels, above which the price is likely to gain bullish momentum. The next resistance is near the $42,000 level.
Will Bitcoin (BTC) Drop?
If bitcoin fails to break the $39,800 resistance, it could start a downside correction. An initial support on the downside is near the $38,600 level.
The first major support is near the $38,000 level. The main support is currently forming near the $37,500 level. This is close to the 50% Fib retracement level of the bullish wave from the $34,916 high to $39,849 high. A downside break below the $37.500 support zone could push the price towards the 100 hourly SMA.
Technical Indicators
- Hourly MACD – The MACD is now losing momentum in the bullish zone.
- Hourly RSI (Relative Strength Index) – The RSI for BTC/USD is correcting lower from the 75 level.
- Main Support Levels – 38,000 then $37,500
- Main Resistance Levels – $39.500, 39.800 and $40,000


 41394
41394


